Much to my surprise and suspicion, for Christmas this year I received a DNA testing kit. The Geno 2.0 kit from National Geographic is one of a handful of “test-at-home” kits currently on the market that allow you to send a sample of your DNA to a private lab to be sequenced and analyzed. While some kits specialize in finding unknown relatives or examining your medical risks, the Geno kit promises an “unprecedented view of your ancestral journey”—it focuses on comparing your DNA to stock samples from reference populations throughout the world, and using this information to determine the migration path your distant ancestors took. It also claims to determine your relationship to various hominids, like Neanderthals and Denisovans, whose DNA samples have recently become available.
The kit contains two cheek swabs and two vials of preservatives—I rubbed the swabs inside my cheek, deposited the cotton ends inside the vials, and sent them to Texas for six weeks of processing. The Geno kit appears to be processed at a different type of facility than other kits (such as 23andMe) because it looks for a different set of genetics markers. Due to its emphasis on determining distant lineages and ancestral relationships, the Geno kit focuses on haplogroups, genetic material that remains largely unchanged over many generations. These portions of our DNA are less useful for diagnostic purposes because they are less unique from person to person (ie, they cannot be easily used for genetic fingerprinting), but they instead are useful for determining the relationships among large populations who share similar traits. The two haplogroups of particular interest for the kit are the male Y chromosome and maternal mitochondrial DNA. The idea is that Y chromosomes don’t change much from generation to generation—my father’s Y is the same as his father’s Y, which is the same as that of every male ancestor in his family. Compare this to X and other chromosomes, which get jumbled and reshuffled in every generation by meiosis, in which chromosomes from the father and mother that serve similar functions (such as the chromosome for eye color) get mixed and matched to build a final offspring genome consisting of traits that are a mixture of those of the father and mother. Since males have only one Y chromosome (there is not another similar chromosome from the mother’s genome), this shuffling doesn’t happen during reproduction, and so the Y chromosome can remain largely identical over thousands of generations, save for the occasional random mutation. A similar idea applies to mitochondrial DNA, which is passed down on the mother’s side only. The idea is that mitochondria, the individual organelles within cells that provide energy, contain their own, unique genome from the rest of the cell, which may be a leftover from a time when mitochondria lived independently outside of cells. Since the first cell of every human arises from a mother’s egg, our mitochondria are copies of our mother’s mitochondria, and so the mitochondrial DNA of a single person traces her maternal ancestry.
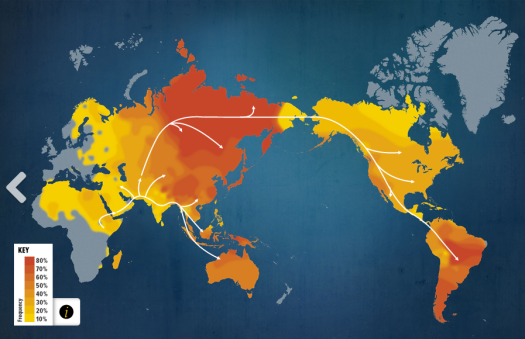
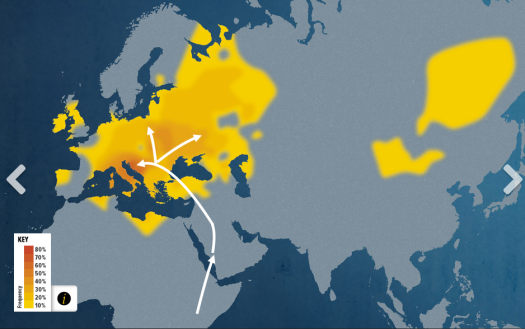
This basically means that, if you’re male, the Geno 2.0 kit can isolate DNA unique to your father and his male ancestors, as well as your mother and her female ancestors, allowing it to greatly simplify the analysis necessary to determine your ancestry—without haplogroups, it would be impossible to determine whether a given mutation or pattern in the DNA occurred recently or thousands of generations ago, or which parts of the genome came from which side of the family. This means that it can generate custom plots like this one, showing the migration route of known early humans who carried my maternal haploid group (first image) and known groups who bore my paternal haploid (other image). My mother happens to have ancestors from more parts of the world than my father, and so it is unsurprising that her genes are better-traveled according to the plot—the original humans who carried her mitochondria traveled widely, and so they have descendants in parts of the world ranging from the Paraguay to Mongolia. My father has a more direct ancestry, which is reflected in the comparatively small range in which his Y chromosome is found.

A heatmap showing the density of my maternal haploid group among the current world population. My maternal ancestors travelled widely, as people with my maternal traits are found in high concentrations throughout the world.

A heatmap showing the density of my paternal haploid group among the current population of Eurasia. People with my paternal lineage tend to be concentrated in Northern Europe.
However, isolating the DNA itself would be useless without other sets of genomes to which to compare it, a task aided by the Genographic Project, a research effort which has accumulated a database of thousands of haplogroup DNA samples for very specific subpopulations of current humans. Representatives of the Genographic project have gone into certain parts of the world that have relatively homogenous populations, such as Mongolia or New Zealand, and collected hundreds of DNA samples from various individuals. Assuming that the individuals tested are descended from people who also lived in the area for many generations (ie, no recent immigrants), then many of the individuals tested will have similarities in their haplogroup that suggest common ancestors on their male and female sides. From this pool of results, researchers can then construct a sort of “average” genome that is taken as representative of members of that population. For example, all people who are descended directly from the original Oceanic settlers in New Zealand might have a certain genetic pattern (let’s call it “Pattern A” to be pedantic) that has been passed down to all of their descendants in modern New Zealand. However, along the way, Dutch or British settlers likely intermarried with the descendants of the original Oceanians, which would introduce another Pattern B that would also be present in modern-day New Zealanders. A researcher looking at the sequences of many modern day New Zealanders might notice that all have Pattern A, but only some have Pattern B—this would allow her to infer that pattern B likely comes from a more recent ancestor (like the later settlers), while Pattern A comes from the original Oceanians. This means that the “average genome” taken as representative of the entire population would likely include Pattern A but not Pattern B, since Pattern A is a more common trait that represents earlier ancestors.
Naturally this process gets incredibly noisy when one has all sorts of different waves of settlers from different countries, as well as a millions of possible patterns that may or may not represent ancestral traits. While occasionally scientists will get lucky and find actual DNA from an early human to which they can compare modern DNA, most of the data available to construct ancestry trees comes from present populations, which already have thousands of generations of genetic intermingling behind them. The Genographic Project thus uses masterful statistical analysis and data processing to automate searching for common patterns in the genomes it samples—instead of looking for just single patterns, it also looks for relationships among groups of patterns. The only upshot to this guessing game is the sheer number of people available for testing today, which allows reasonably strong statistical confidence to be established in the most dominant trends. My results, shown below, correctly places my ancestry as dominated by a single group, Southern Indian, which agrees with my mother’s family history. At the same time, no genetic group is represented in more than 50% of my genome, in part because my parents are from two very different parts of the world and thus have very different reference populations.

A breakdown of the percent my haploid groups share in common with reference populations being studied for the Genographic Project. The dominant component, Southwest Asian, matches my mother’s family’s origin in Southern India.
In general, I am impressed by the unique analysis and processing that the Geno 2.0 kit offers, and I am glad to know that my test results will help improve the Genographic Project’s massive database of reference populations. However, my main concern with the test results is the sparseness of final information given the supposed rigor of the analysis. While I am hoping that more analysis of my results will arrive as better data processing technology becomes available, I would appreciate it very much if projects like these made raw sequence data available–it would be easy to do, and it would allow either after-market companies or savvy individuals to further process and analyze the information that the Genographic team has gathered.