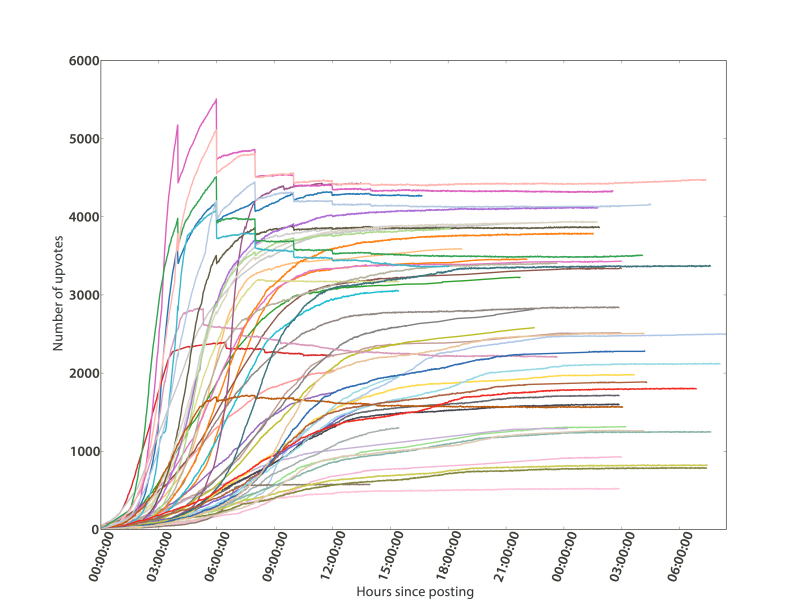
A plot of the score versus hour since posting for 53 different posts in /r/pics over the span of one month
I wrote a program that algorithmically monitors viral links in the subreddit /r/pics in order to see whether I can identify traits of posts that tend to become popular through the site. Users can give a thumbs up or thumbs down vote to a picture posted on the /r/pics subdomain of the site, and the total “score” of a post is given by the number of “up” votes minus the number of “down” votes. The individual pages of reddit look essentially like long lists showing various posted images sorted by a combination of their total score and how recently they were posted. This system ensures that users can easily view very popular, fresh material generated by other users, like funny pictures of pets or beautiful pictures of the sunset. A very popular image can make the “front page,” or the default landing page that a user visiting reddit.com will see, and this can result in an image accruing millions of unique pageviews over just a few short hours.
In the image at the top of this post, I’ve plotted the score as a function of time since posting for 53 links posted during the month of July. The content of these image links is remarkably varied, ranging from a beautiful image of Dubai to an adorable three-legged cat. They all appear to display qualitatively similar behavior—rapid exponential growth followed by a plateau at a final total number of upvotes, resulting in an overall sigmoidal shape—but their traits like initial growth rate, maximum growth rate, and position of asymptote vary widely. One aspect of this behavior I want to investigate further in the future is the relationship between these voting patterns and logarithmic random walks, which may reveal meaningful correlations between properties like the growth rate and the final score.
The key feature of reddit that I was hoping to study by tracking posts is the degree to which reddit and its admins “fuzz,” or artificially interfere with the score of posts in order to ensure that viral posts are not subject to vote manipulation by computer programs or automated voting software. This practice allows the admins to alter (or diminish) the reported score of popular posts in order to prevent users from manipulating the website. For this reason, many “viral” posts that accumulate large numbers of upvotes (and which subsequently make it to the front page of the website) will report a score of 1000-5000, even though their actually score may be an order of magnitude greater than that. This practice is clearly responsible for the asymptotes in the score versus time graph, but it also manifests as the dramatic drops in score observed in many of the most popular posts on the graph. Since the links were not all posted at the same time—I’ve shifted the data in order to display it as “time since posting”—these sudden drops in score appear to occur at the same time relative to the original posting date, since the discontinuities line up at regular intervals in the graph. I have not yet been able to find a definitive explanation for why this occurs, but I would guess that it serves to prevent posts that reach the front page extremely rapidly from staying there for days due to their high initial priority. This would suggest that a user who is looking to maximize the final score of their posts ought to post links that are popular, but not so popular that they activate this automatic vote culling.

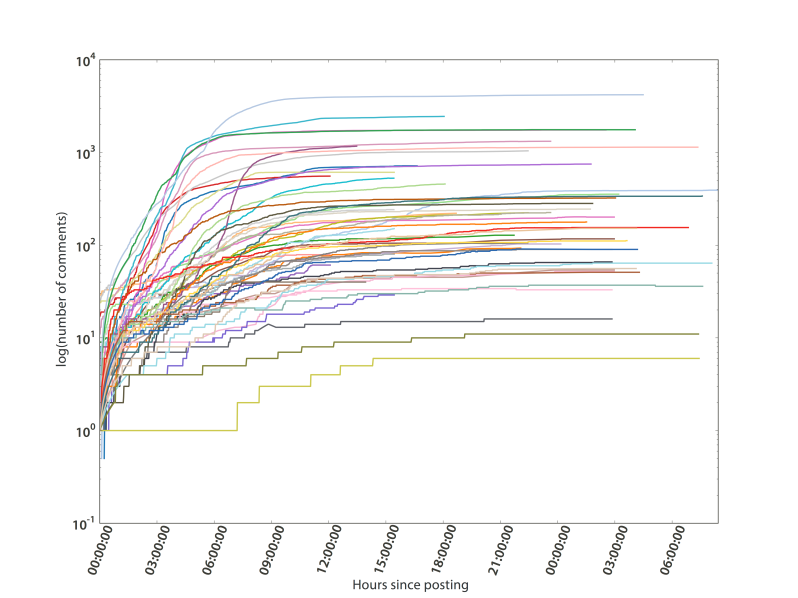
A semilog plot of the number of comments versus hours since posting for 53 different posts in /r/pics over the course of one month.
Another interesting feature of reddit lies in the ability of users to comment on one another’s posts. I made a similar plot to the score versus time (above), and the results and similarly sigmoidal for all posts, although the two time constants dictating initial growth rate and approach to saturation both appear to be much slower, presumably because reddit doesn’t “fuzz” comments. I used a semilog plot to display this data, since otherwise the field was too crowded to see the data properly.
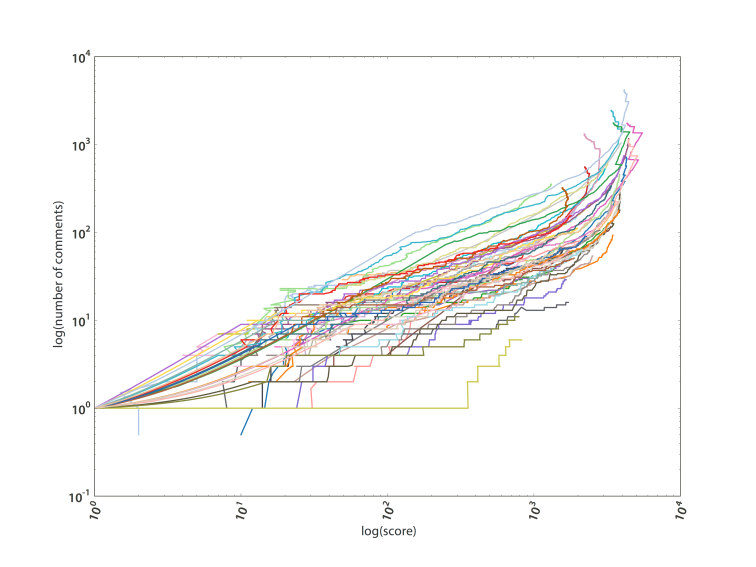
Another interesting property is the correlation between the score at a given timepoint and the number of comments—presumably more popular links generate new comments at a faster rate, leading to a superlinear correllation between the number of comments and the score. This behavior is confirmed in the log-log plot shown above, which appears linear for many of the posts with a surprisingly narrow range of slopes. Since lines on a log-log plot correspond to power-law behavior, this plot suggests that there may be universal power law (with a narrow range of critical exponents) that dictates the growth of comments over time for popular posts. It’s worth noting that popular reddit posts appear to accrue comments indefinitely, even after their score has stabilized, and so the above graph doesn’t fully capture the saturation region for comments over long timescales (in which comments increase but score remains the same, captured by the “uptick” at high score for some of the trendlines.
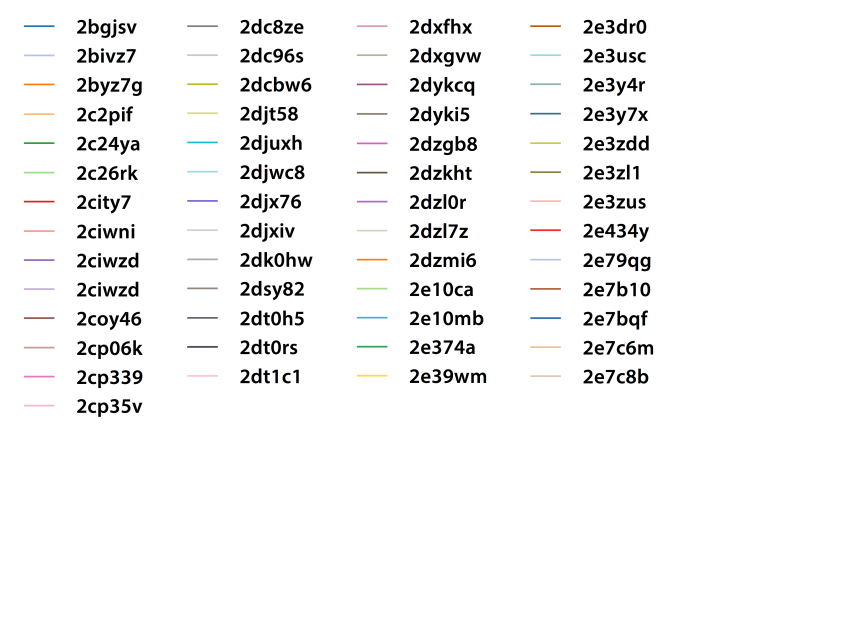
While it’s probably tedious to keep track of 53 different colors, here is a legend showing the post ID for all the posts depicted here. The original link can be generated by inserting the 5 character string into appropriate place in the reddit url: http://www.reddit.com/r/pics/comments/2byz7g
This analysis was made possible using the PRAW and pandas packages for Python.

The post ID for each of the 53 posts in /r/pics shown in the previous figures. Individual posts can be viewed by inserting the post ID into a url of the form:
http://www.reddit.com/r/pics/comments/2bgjsv
